In a nutshell
In the US alone, tens of millions of people suffer from allergies each year. Better predictions of airborne pollen can inform allergy sufferers when to stay indoors or when pharmacies should stock allergy medicine.
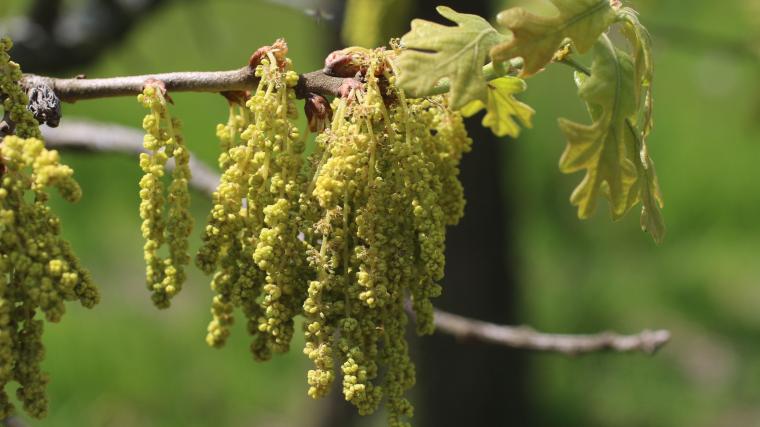
The authors of this study used over 4,000 Nature’s Notebook observations of oak (Quercus) trees in the eastern US to explore the relationship between flowering and air pollen. They determined a strong association between January-April temperature and the presence of open flowers. They used this relationship to predict the day of peak flowering for 15 pollen monitoring stations in 15 years. The predicted peak in flowering was strongly correlated with observed peak airborne pollen at the stations.
What is special about this study?
The millions of records of phenology data curated by the USA-NPN and other phenology networks like the Pan European Phenological database hold untapped potential to inform the timing and severity of pollen season. This article is the first to explore how volunteer-collected phenology data contributed to Nature’s Notebook can be used to support pollen forecasting.
What does this mean for YOU?
Models like the ones explored in this paper can create better forecasts of pollen that can be used to predict the timing and severity of allergy season. Flowering observations, such as those you contribute to Nature’s Notebook, have the potential to fill in the gaps in airborne pollen data, particularly for places that don’t have pollen monitoring stations. Further, since the observations you contribute to Nature’s Notebook are available to users very soon after you submit them, they allow for pollen forecasts to be updated in near-real time with incoming reports.
Citation: Katz, D.S.W., E. Vogt, A. Manangan, C.L. Brown, D. Dalan, K. Zhu, Y. Song and T.M. Crimmins. Observations from the USA National Phenology Network can be leveraged to model airborne pollen. Aerobiologia. doi.org/10.1007/s10453-022-09774-3